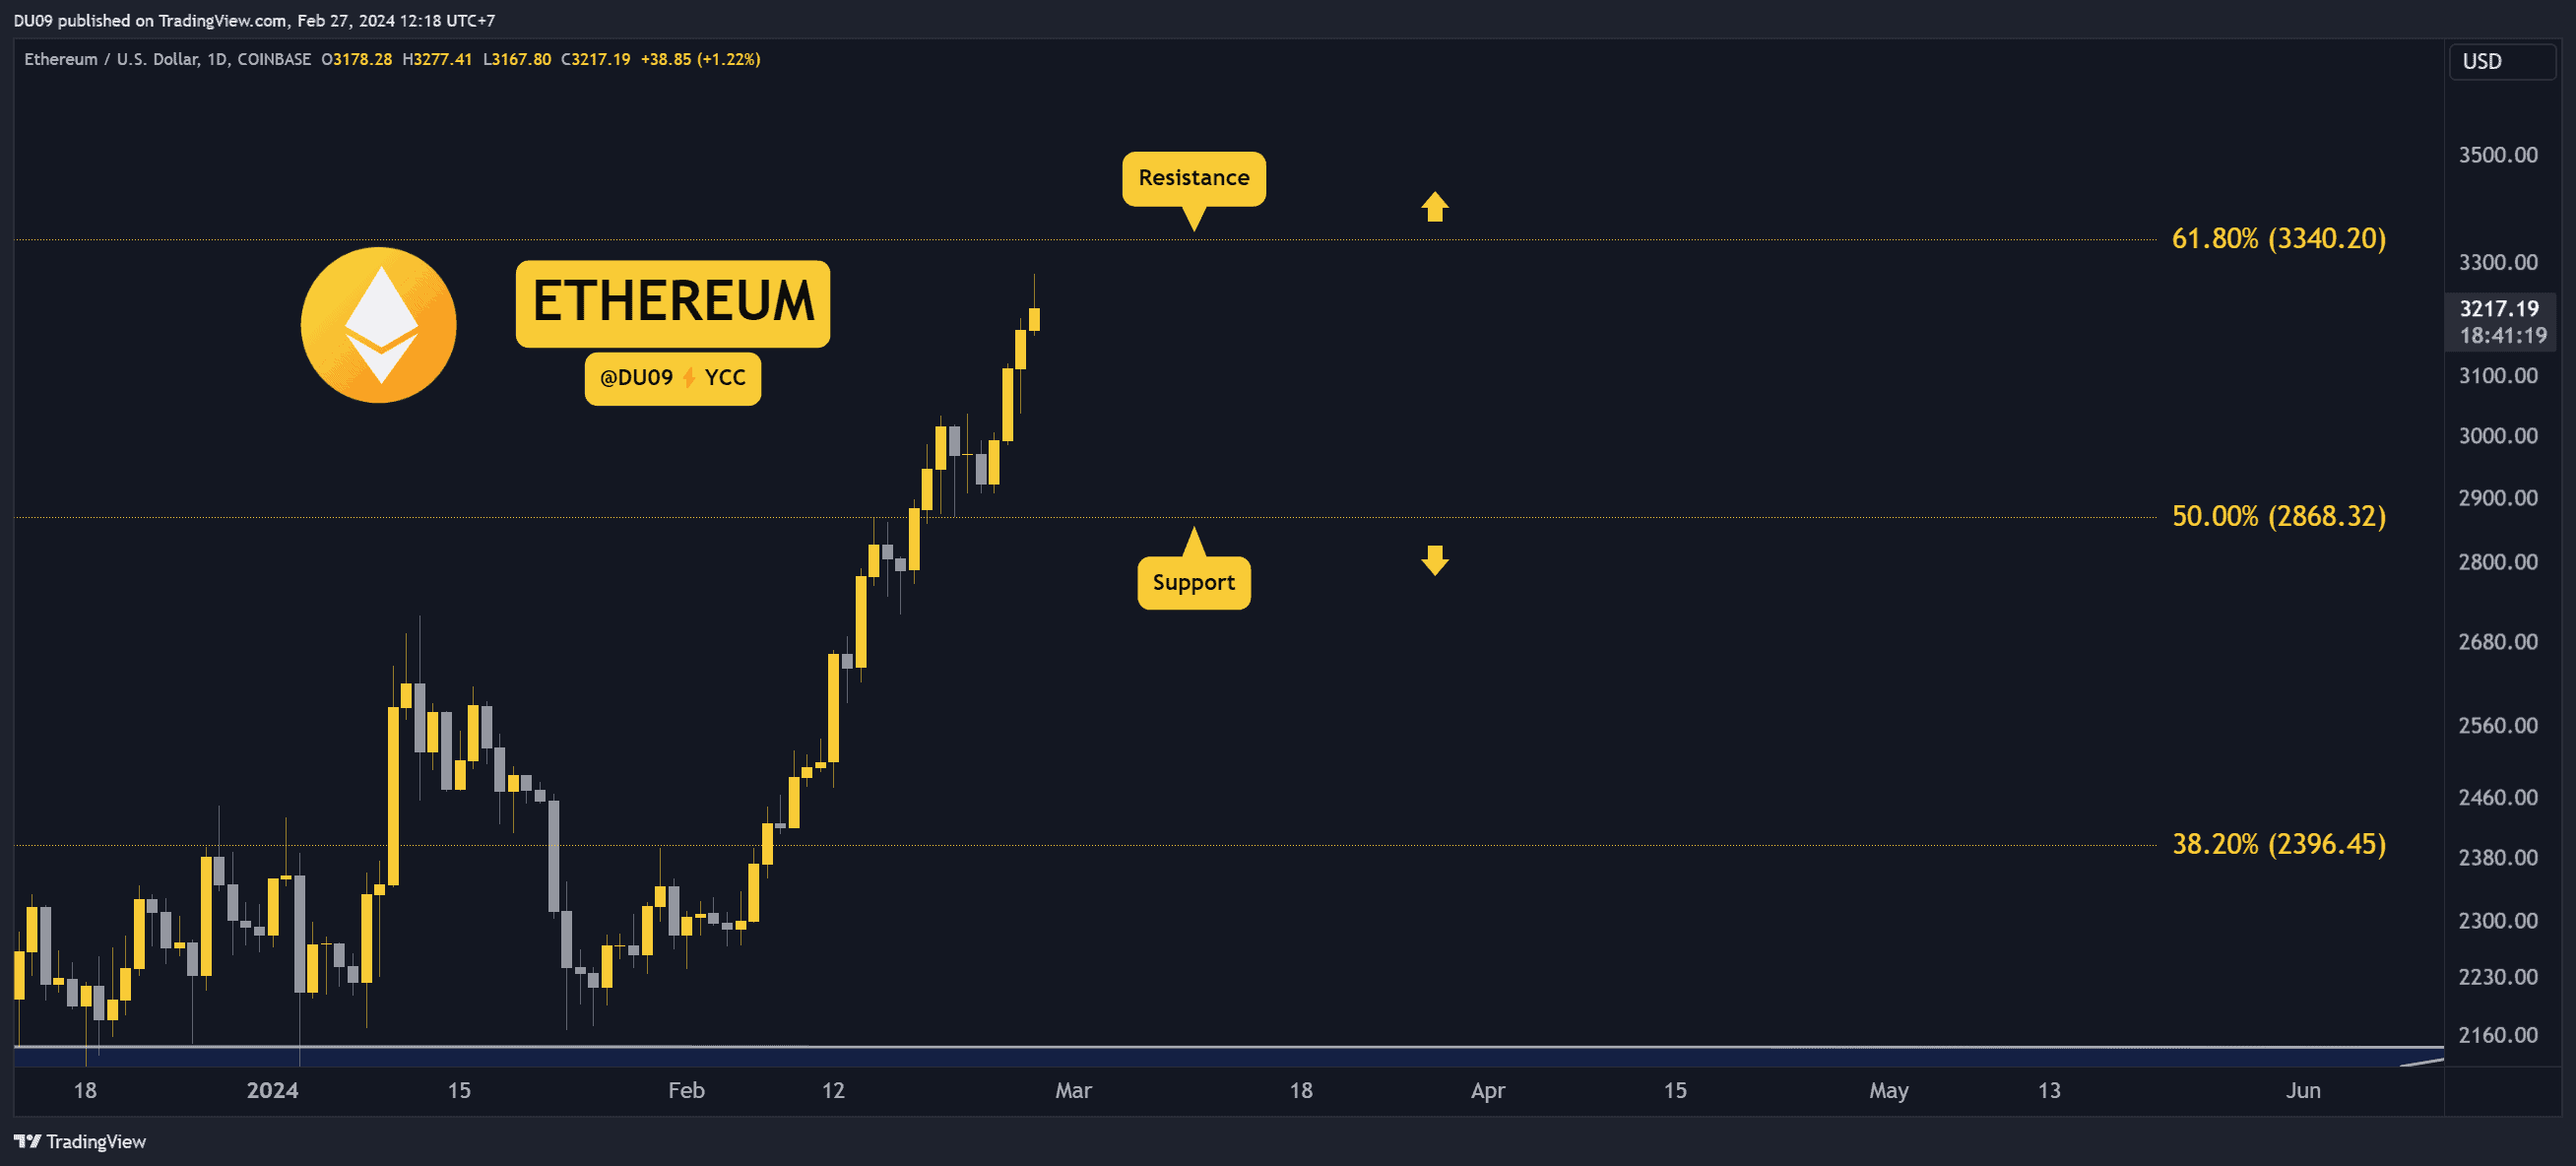
3 Things to Look in Ethereum After the ETH Price Broke Above $3.2K
After Ethereum broke above $3,000 the price appears unstoppable. In the following, we take a look at a few technical indicators that might provide some insights into why the ETH price made a new yearly high.
Key Support levels: $2,860
Key Resistance levels: $3,340
1. New Yearly High
The ETH rally is not stopping. The price reached over $3,200 today before a short pullback started. The key resistance at $3,340 is very close and may offer an opportunity for sellers to return. Watch closely that level as it is decisive where ETH goes next.
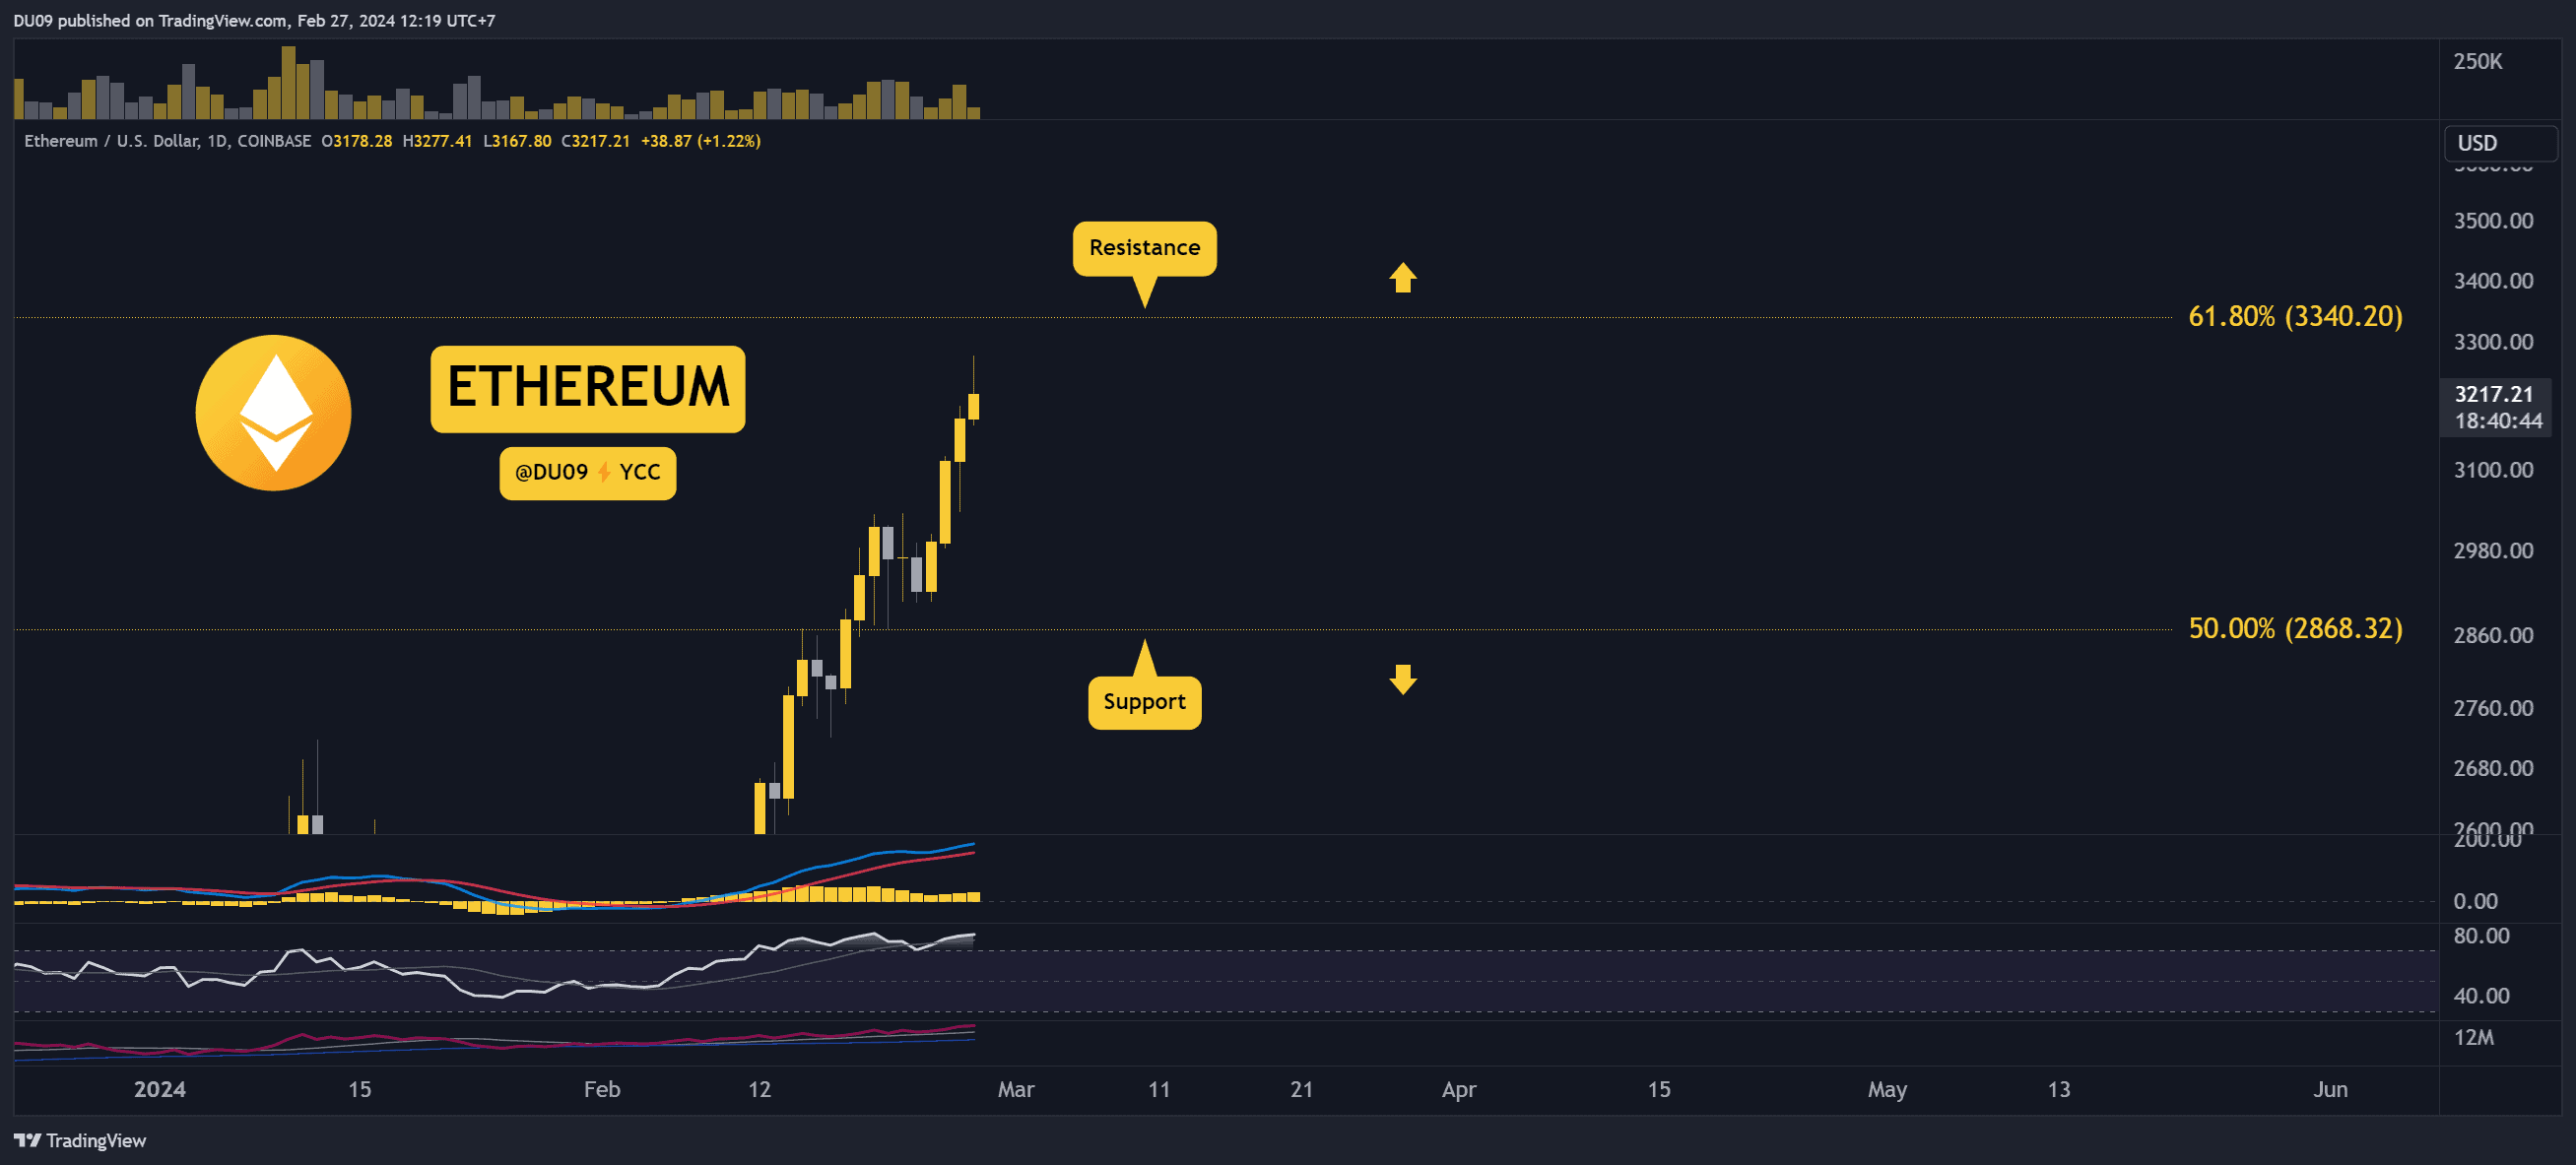
2. Momentum Indicators Remain Bullish
The bias on this price action is bullish. However, this latest yearly high did not have the same volume as in the past. If the buying volume does not increase, then sellers could take over.
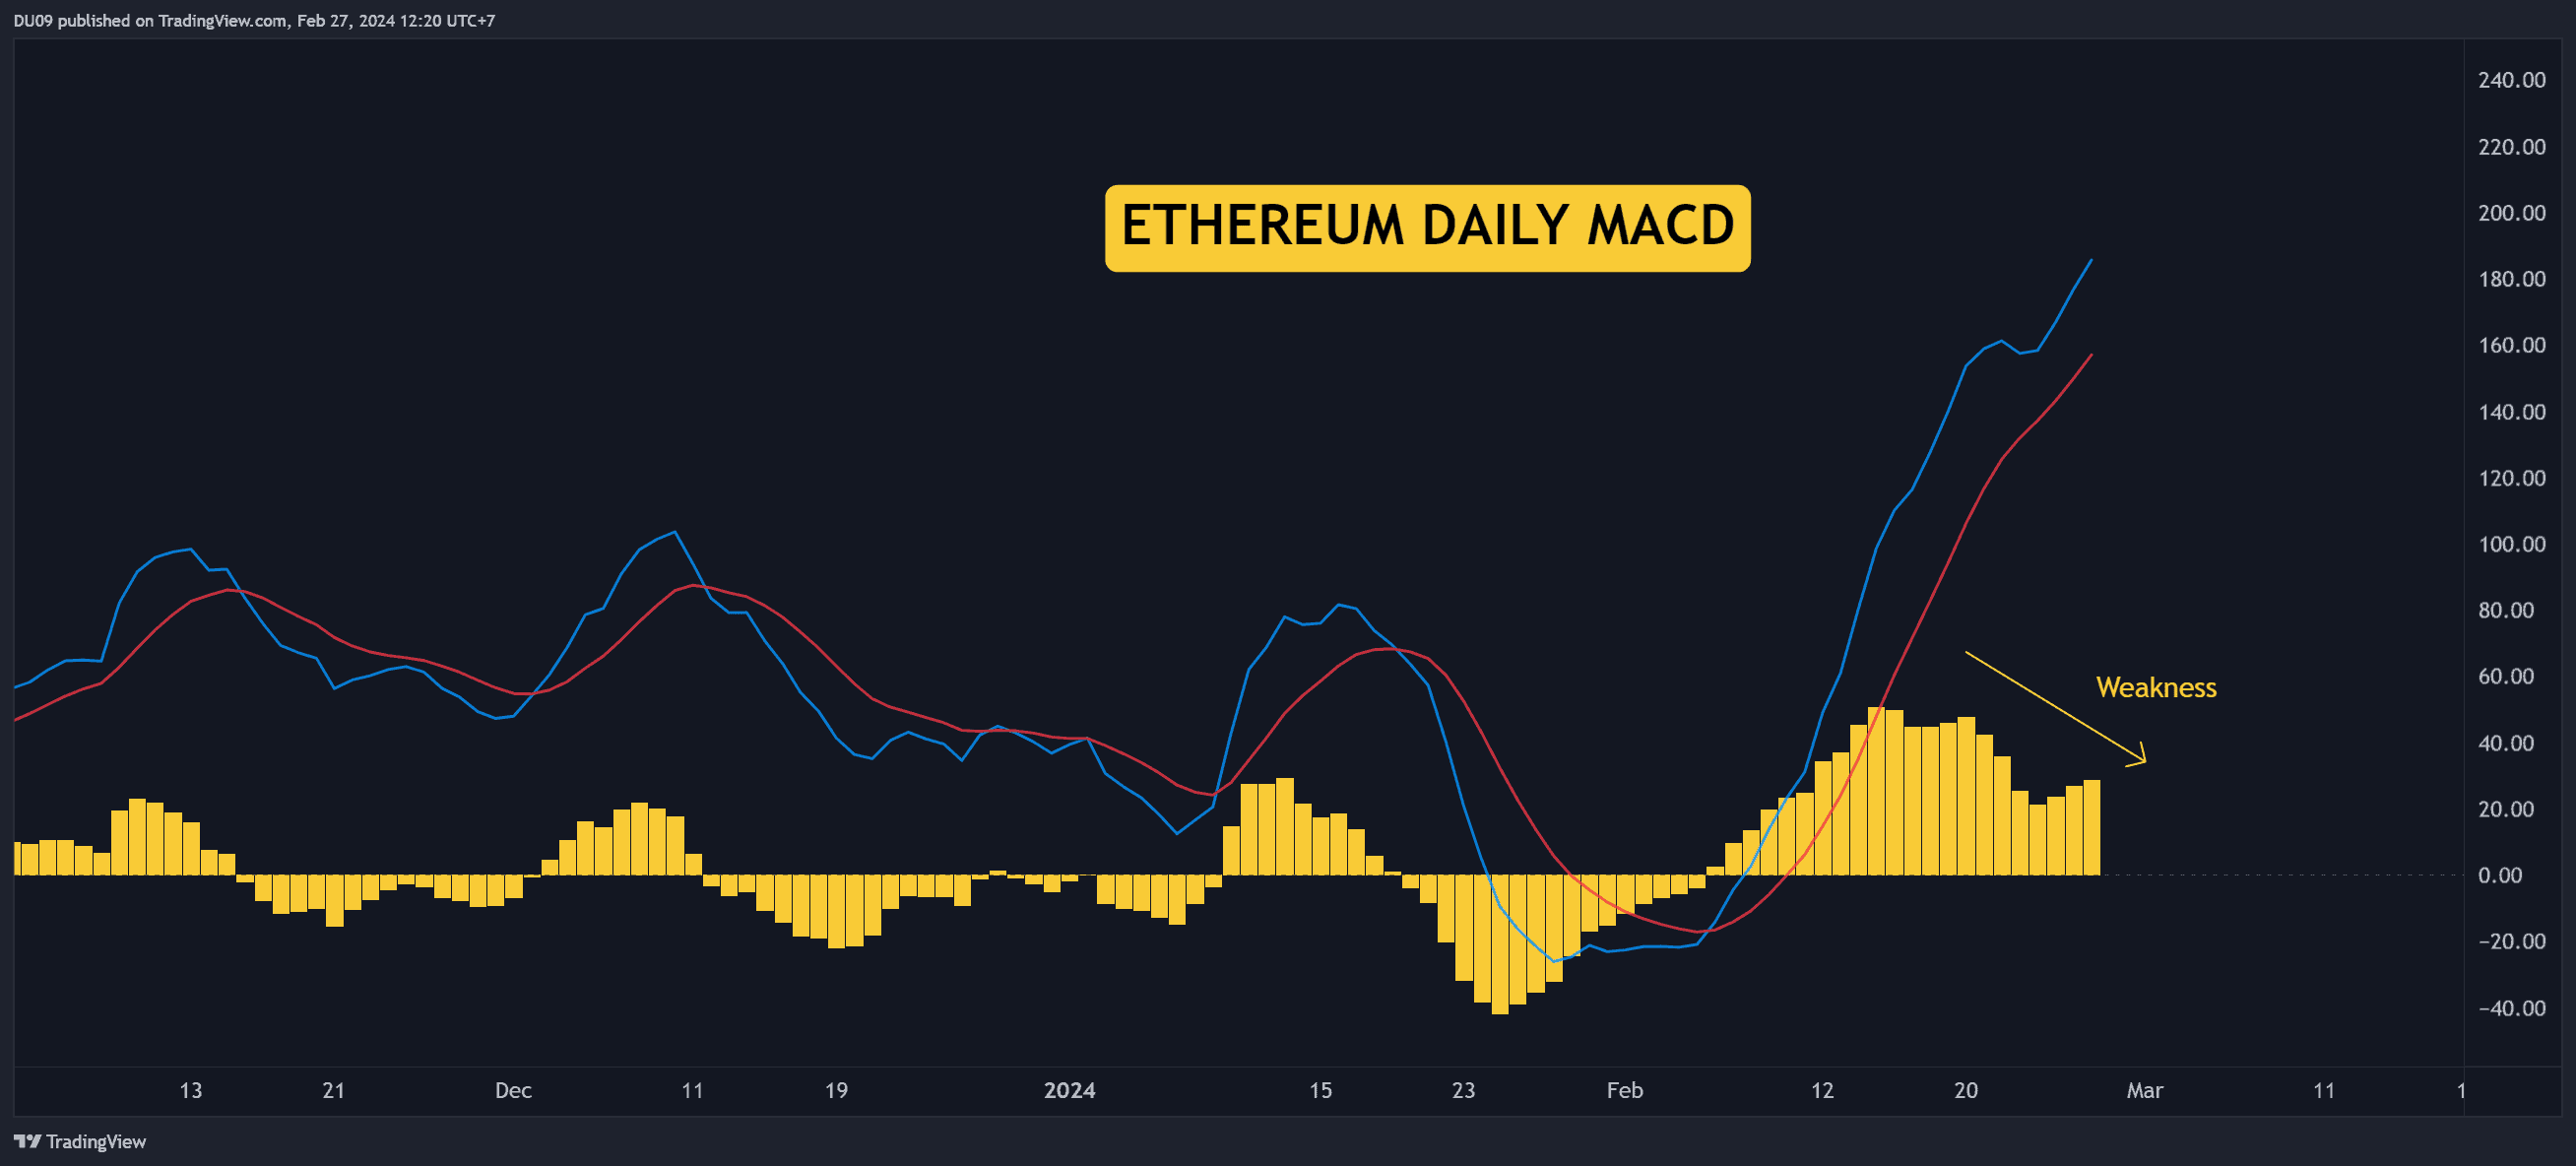
3. Daily MACD Shows a Bearish Divergence
The price made a new high, but the daily MACD histogram made a lower high. This is called a bearish divergence and could signal that buyers are losing strength. To confirm this, sellers have to stop the rally at the key resistance.
The post 3 Things to Look in Ethereum After the ETH Price Broke Above $3.2K appeared first on CryptoPotato.